Crypto technical analysis: your essential guide to reading crypto data


Though technical analysis in the cryptocurrency market might seem daunting, the term simply refers to the study of past market data in an effort to project future price movements. In essence, it allows us to make educated guesses about whether a digital asset’s price will increase or decrease in the future.
In this article, we will briefly explain the most essential tools for conducting basic technical analysis in an effort to start you on your journey to charting BTC and other cryptocurrencies and up your crypto trading game.
Candlestick charts
Though there are different kinds of charts — such as line charts and bar charts — candlestick charts are one of the most effective.
Originating in Japan over a century ago, candlestick charts visually display the size of price moves in different colors — frequently green for a positive candle and red for a negative candle.
Each candlestick displays four critical components for the desired time frame:
- Open price
- High price
- Low price
- Close price
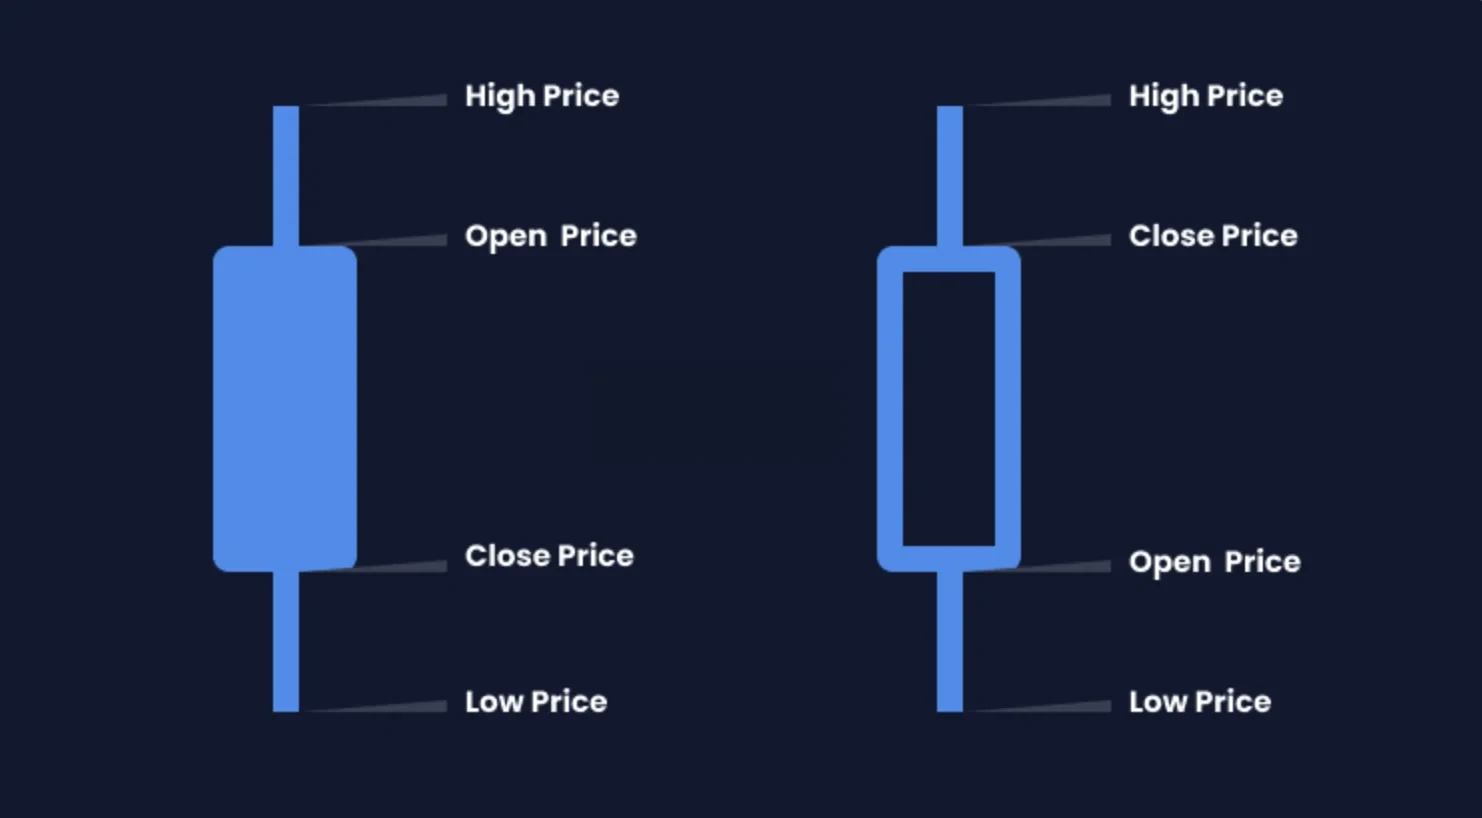
These components not only provide a plethora of useful information in an easy-to-read and concise format, but they also allow for the identification of various candlestick patterns. While there are a lot of candlestick patterns that we will not detail here, some simple ones include bullish and bearish engulfing patterns.

Support and resistance
One of the most simple and effective methods of conducting technical analysis is to identify areas of support and resistance — where a digital asset’s price is expected to stop decreasing or stop increasing, respectively.
Because the cryptocurrency market is simply an exchange between buyers and sellers, it stands to reason that demand for a digital asset increases as its price decreases, and vice versa — at least, in theory. This essential principle is largely responsible for creating both levels of support and resistance. Simply put, the market often has an interest in buying or selling at a certain price, which creates levels that are difficult to break through.

Identifying key levels of support and resistance may be useful in planning trades. For example, the more times a level of support or resistance is tested, the weaker it tends to become. A prime example of this is illustrated above — when the price of BTC ultimately collapsed through its near-year-long support level of roughly $6,000 in 2018.
Trend lines
Another basic technical analysis tool that is of critical importance is the trend line — which, as the name implies, is a line that is used to identify a trend.
By tracing the tops or bottoms of candlestick patterns, a technical analyst may identify a clear bullish or bearish trend for the price of a cryptocurrency and adjust their trading strategy accordingly.

Moving averages
Moving averages are a popular and easy-to-use lagging indicator that smoothes out price volatility and paints a clearer picture of what a digital asset’s average price is over a specified period of time.
There are two primary types of moving averages:
- Simple moving averages
- Exponential moving averages
Simple moving averages use the arithmetic mean of a set of prices, while exponential moving averages give recent price action more weight.
Moving averages may be used alone or in conjunction with each other. For example, we often use a ribbon of exponential moving averages on the four-hour candlestick chart in our Crypto Market Daily analyses. This ribbon consists of eight EMAs, ranging from 20 to 55 in increments of five — meaning it takes the average of the past 20 to 55 candlesticks while putting more weight on recent price activity.

In trending markets, the EMA ribbon may prove useful, as it clearly illustrates in which direction a market is trending and where areas of support or resistance may be found.
Relative strength index
The final tool we will discuss in this article is the Relative Strength Index, which is a momentum indicator that is primarily used to identify whether or not a cryptocurrency is overbought or oversold. Traditionally, RSI values over 70 indicate that a digital asset is overbought and values under 30 indicate that it is oversold.
However, when it comes to BTC and other cryptocurrencies, the RSI may not be the most reliable indicator. BTC has proven that it is prone to extended bull runs that see its price repeatedly become, and often stay, overbought. Nevertheless, it may be useful for identifying when a pullback could be on the horizon.

If you’re ready to level up with more advanced cryptocurrency technical analysis, check out our latest Learn articles.
Digitale aktiva er utsatt for volatilitet og er ikke forsikret. Ikke finansiell/investeringsrådgivning. Ikke alle produkter og tjenester tilbys i alle regioner. Unntak og vilkår og betingelser gjelder.
© 2026 OKX. Denne artikkelen kan gjengis eller distribueres i sin helhet, eller utdrag på 100 ord eller mindre av denne artikkelen kan brukes, forutsatt at slik bruk er ikke-kommersiell. Enhver gjengivelse eller distribusjon av hele artikkelen må også tydelig angi: «Denne artikkelen er © 2026 OKX og brukes med tillatelse.» Tillatte utdrag må sitere navnet på artikkelen og inkludere kildehenvisning, for eksempel «Artikkelnavn, [forfatternavn hvis aktuelt], © 2026 OKX.» Noe innhold kan være generert eller assistert av verktøy for kunstig intelligens (AI). Ingen bearbeidelser eller annen bruk av denne artikkelen er tillatt.